Grafana is an open-source analytics and monitoring platform designed for visualizing and analyzing data from various sources. It provides interactive and customizable dashboards to help users monitor metrics, logs, and other data in real-time.
Key features of Grafana include:
-
Customizable Dashboards: Create and share interactive, real-time dashboards with a variety of visualizations like graphs, heatmaps, and tables.
-
Data Source Integration: Connects to multiple data sources, including databases, cloud services, and monitoring tools like Prometheus, InfluxDB, and Elasticsearch.
-
Alerts and Notifications: Set up alerts based on specific conditions and receive notifications via email, Slack, or other channels.
-
Query Editors: Use powerful query editors to retrieve and filter data from connected sources.
-
User Management: Manage user access and permissions for dashboards and data sources.
-
Plugins and Extensions: Extend functionality with a wide range of plugins for data sources, visualizations, and app integrations.
-
Real-Time Monitoring: Provides real-time updates and visualizations to monitor system performance and application metrics effectively.
Grafana is widely used for IT infrastructure monitoring, application performance management, and business intelligence, helping organizations gain insights from their data and make informed decisions.
Log in to portal.antyxsoft.io and during the instance creation at the Select Template section click on the Market Place App
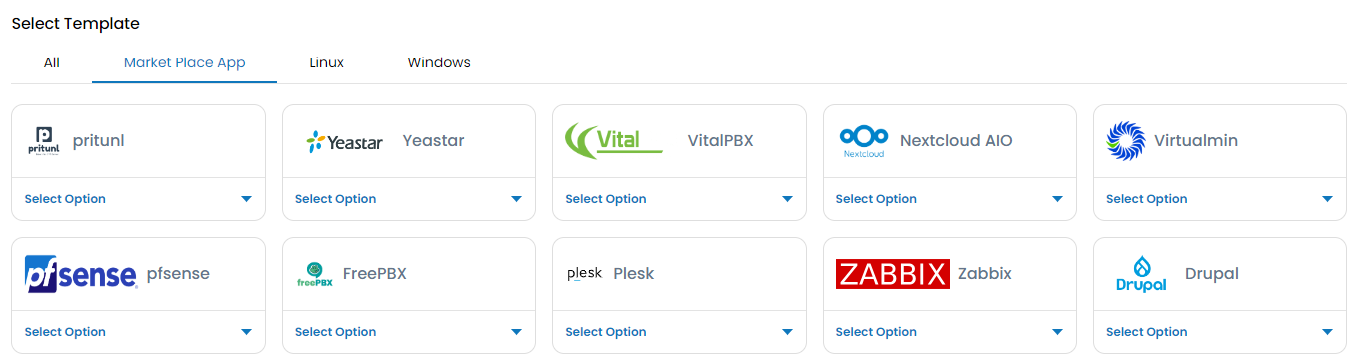
Select the ready to go Grafana template from the list of available templates and deploy it.
Supported By: Antyxsoft
Docs: docs.antyxsoft.io/grafana
Team Support Hours: 08:00 to 17:00 (EEST)
Support Email: [email protected]